Learn more about our updated analytics experience
Account Level Metrics:
Cloud Campaign now supports detailed Account-level analytics, available by clicking on the “Account” link under the “Analytics” category in the left nav. The “Historical” screen has been renamed to “Post”, and follower metrics have been moved from the former “Historical” screen to the new “Account” screen.
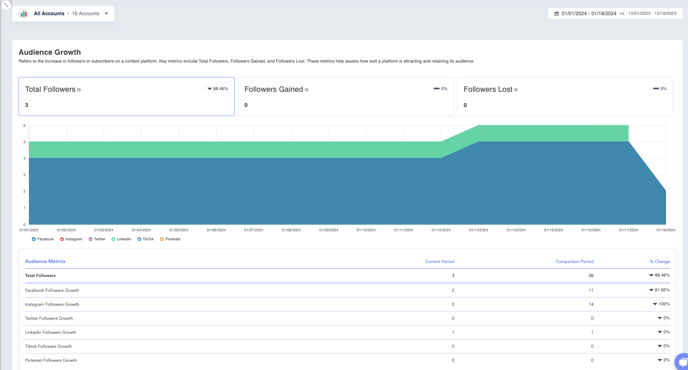
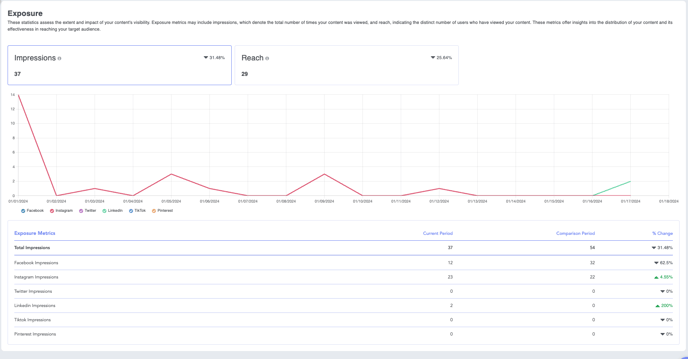
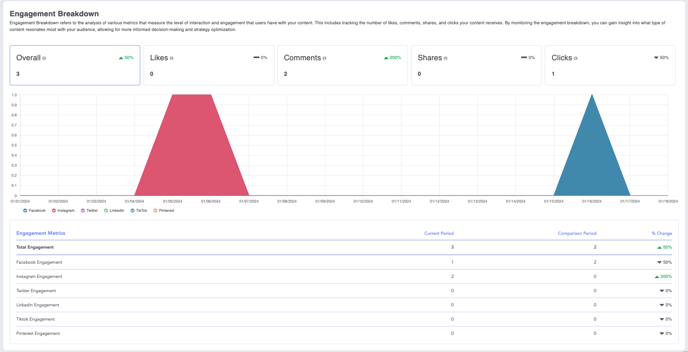
The new “Account” Analytics screen supports the selection of Accounts, a base date range, as well as a comparison period. When a comparison period is set, the detailed metric breakdowns below each chart include the delta between the period and comparison period.
- Example: If you’re looking at January 1-15th, page level data will show activity that took place during that time, regardless of when the post was published.
Audience Growth- Shows follower growth over period of time, broken down by account
Exposure- Shows total impressions and unique account reach
Engagement Breakdown- Total engagement metrics over period of time + change
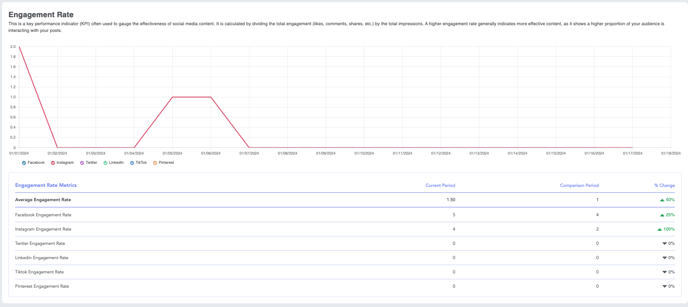
Engagement Rate- Proportion of your audience engaging on content. Shows effectiveness of the content being posted
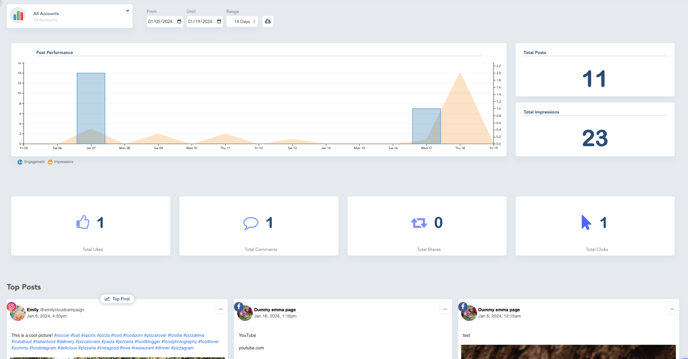
Post Level Metrics (previously labeled Historical):
- Think of this more as a lifetime value measurement. This measures the activity that happens to a post over time
- When pulling a report for December, this will show analytics for posts published during December only